Alpha Dynamic Momentum Index Pine@v=4- What Is Dynamic Momentum Index?
- The dynamic momentum index is a technical indicator used to determine if an asset is overbought or oversold. It can be used to generate trade signals in trending and ranging markets.
- The dynamic momentum index was developed by Tushar Chande and Stanley Kroll and is similar to the relative strength index (RSI). The main difference between the two is that the RSI uses a fixed number of time periods (usually 14) in its calculation, while the dynamic momentum index uses different time periods as volatility changes, typically between five and 30.
- The number of time periods used in the dynamic momentum index decreases as volatility in the underlying security increases, making this indicator more responsive to changing prices than the RSI. This is particularly useful when an asset's price moves quickly as it approaches key support or resistance levels. Because the indicator is more sensitive, traders can potentially find earlier entry and exit points than with the RSI, but it could also be more prone to whipsaws and false signals.
"Relative Strength Index (RSI) " için komut dosyalarını ara

Combo Backtest 123 Reversal & Relative Volatility Index This is combo strategies for get a cumulative signal.
First strategy
This System was created from the Book "How I Tripled My Money In The
Futures Market" by Ulf Jensen, Page 183. This is reverse type of strategies.
The strategy buys at market, if close price is higher than the previous close
during 2 days and the meaning of 9-days Stochastic Slow Oscillator is lower than 50.
The strategy sells at market, if close price is lower than the previous close price
during 2 days and the meaning of 9-days Stochastic Fast Oscillator is higher than 50.
Second strategy
The RVI is a modified form of the relative strength index (RSI).
The original RSI calculation separates one-day net changes into
positive closes and negative closes, then smoothes the data and
normalizes the ratio on a scale of zero to 100 as the basis for the
formula. The RVI uses the same basic formula but substitutes the
10-day standard deviation of the closing prices for either the up
close or the down close. The goal is to create an indicator that
measures the general direction of volatility. The volatility is
being measured by the 10-days standard deviation of the closing prices.
WARNING:
- For purpose educate only
- This script to change bars colors.

RSI.TrendContext
The Relative Strength Index (RSI) is one of the most widely used classical indicators in technical analysis, typically employed to identify overbought or oversold market conditions. It reflects the degree of upside or downside dominance within a specified period. However, in its standard form, RSI is not particularly effective as a standalone entry trigger.
The RSI.Trend indicator enhances the RSI to provide a more reliable method for distinguishing between bullish and bearish market regimes and offers specific entry triggers. It adds supplementary value to the pure RSI read.________________________________________
Concept
In trending markets, an Exponential Moving Average (EMA) of the price is often smoother and more stable than raw price data. As a result, the RSI calculated on this smoothed price (i.e., the EMA) tends to react earlier and more consistently than the standard RSI. Specifically:
• In uptrends, the RSI of the EMA tends to exceed the RSI of the original price.
• In downtrends, it tends to lag behind.
The difference between these two RSI readings provides a stable and less noisy measure of market bias—positive in uptrends, negative in downtrends. The crossing points can serve as entry triggers. This is, what the RSI.Trend is trying to capture.
________________________________________
The RSI.Trend indicator operates as follows:
• It first computes the 5-period EMA of the price series of the underlying ("EMA5").
• It calculates the 14-period RSI of the original price series ("RSI") as well as the 14-period RSI of EMA5 ("RSIEMA").
• It then determines the 14-period EMA of RSI ("RSI.MA") and RSIEMA ("RSIEMA.MA").
These values are used to define a Baseline and a Trigger Line:
• Baseline: The average of RSI and RSI.MA.
• Trigger Line: The average of RSIEMA and RSIEMA.MA.
Essentially, the baseline represents a smoother version of the RSI of the original price series, while the trigger line is a smoother version of the RSI on the EMA5 of the original price series.
Additionally, the RSI.Trend Background Value is calculated as the difference between the Trigger Line and the Baseline, slightly accelerated by incorporating the current bias of this difference. This acceleration causes the Background Value to react somewhat faster than the pure difference between the two lines.
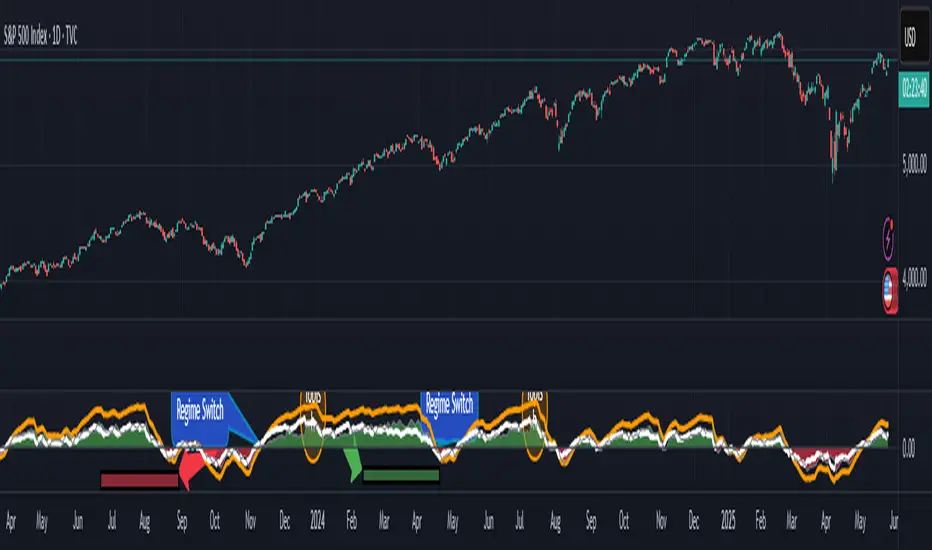
How to use the RSI.Trend:
• As mentioned in the introductory context, during uptrends, the trigger line remains above the baseline; in downtrends, it stays below the baseline.
• A crossover of the baseline by the trigger line indicates a regime shift from bearish to bullish and can signal avoiding adding short positions, closing short positions, or adding long positions.
• A crossunder of the baseline by the trigger line indicates a regime shift from bullish to bearish and can signal avoiding adding long positions, closing long positions, or adding short positions.
• The level of the Trigger Line can serve as a confidence indicator; for instance, if the trigger line crosses under the baseline coming from very high values, it implies high confidence.
• The Background Value indicates the accelerated difference between the two lines:
o > 0 (Green background): Indicates a Bullish regime.
o < 0 (Red background): Indicates a Bearish regime.
The Background Value reacts slightly faster than line crossings due to its acceleration relative to the difference of the two lines.
Including these lines in the script besides the Background Value, provides insight into their levels and their origins, aiding in formulating confidence in an entry trigger, which the background value alone cannot provide. The change in slope of the trigger Line can also be used as an early and fast position-trigger.
Finally, the Background Value can be utilized in continuous trading scenarios (i.e., no entry points, always engaged) as a multiplier on a predefined max-exposure value, representing the current exposure as a fraction of that max-exposure.
The usage of RSI.Trend is also exemplified in the introductory chart.________________________________________
Final Notes
As with all indicators, the RSI.Trend is most effective when used in conjunction with other technical tools and market context. It does not predict future price movements; rather, it reflects current market dynamics and recent directional tendencies. Use it with discretion and as part of a broader trading strategy.
Adaptive Freedom Machine w/labelsAdaptive Freedom Machine w/ Labels
Overview
The Adaptive Freedom Machine w/ Labels is a versatile Pine Script indicator designed to assist traders in identifying buy and sell opportunities across various market conditions (trending, ranging, or volatile). It combines Exponential Moving Averages (EMAs), Relative Strength Index (RSI), Average True Range (ATR), and customizable time filters to generate actionable signals. The indicator overlays on the price chart, displaying EMAs, a dynamic cloud, scaled RSI levels, buy/sell signals, and market condition labels, making it suitable for swing trading, day trading, or scalping.
What It Does
This indicator generates buy and sell signals based on the interaction of two EMAs, filtered by RSI thresholds, ATR-based volatility, and user-defined time windows. It adapts to the selected market condition by adjusting EMA lengths, RSI thresholds, and trading hours. A dynamic cloud highlights trend direction or neutral zones, and candlestick bodies are colored in neutral conditions for clarity. A table displays real-time trend and volatility status.
How It Works
The indicator uses the following components:
EMAs: Two EMAs (short and long) are calculated on a user-selected timeframe (1, 5, 15, 30, or 60 minutes). Their crossover or crossunder generates potential buy/sell signals, with lengths adjusted based on the market condition (e.g., longer EMAs for trending markets, shorter for ranging).
Dynamic Cloud: The area between the EMAs forms a cloud, colored green for uptrends, red for downtrends, or a user-defined color (default yellow) for neutral zones (when EMAs are close, determined by an ATR-based threshold). Users can widen the cloud for visibility.
RSI Filter: RSI is scaled to price levels and plotted on the chart (optional). Signals are filtered to ensure RSI is within user-defined buy/sell thresholds and not in overbought/oversold zones, with thresholds tailored to the market condition.
ATR Volatility Filter: An optional filter ensures signals occur during sufficient volatility (ATR(14) > SMA(ATR, 20)).
Time Filter: Signals are restricted to a user-defined or market-specific time window (e.g., 10:00–15:00 UTC for volatile markets), with an option for custom hours.
Visual Aids: Buy/sell signals appear as green triangles (buy) or red triangles (sell). Candlesticks in neutral zones are colored (default yellow). A table in the top-right corner shows the current trend (Uptrend, Downtrend, Neutral) and volatility (High or Low).
The indicator ensures compatibility with standard chart types (e.g., candlestick charts) to produce realistic signals, avoiding non-standard types like Heikin Ashi or Renko.
How to Use It
Add to Chart: Apply the indicator to a candlestick or bar chart on TradingView.
Configure Settings:
Timeframe: Choose a timeframe (1, 5, 15, 30, or 60 minutes) to align with your trading style.
Market Condition: Select one market condition (Trending, Ranging, or Volatile). Volatile is the default if none is selected. Only one condition can be active.
Filters:
Enable/disable the ATR volatility filter to trade only in high-volatility periods.
Enable the time filter and choose default hours (specific to the market condition) or set custom UTC hours.
Cloud Settings: Adjust the cloud width, neutral zone threshold, and color. Enable/disable the neutral cloud.
RSI Display: Toggle the scaled RSI and its thresholds on the chart.
Interpret Signals:
Buy Signal: A green triangle below the bar indicates a potential long entry (EMA crossover, RSI above buy threshold, within time window, and passing volatility filter).
Sell Signal: A red triangle above the bar indicates a potential short entry (EMA crossunder, RSI below sell threshold, within time window, and passing volatility filter).
Neutral Zone: Yellow candlesticks and cloud (if enabled) suggest a lack of clear trend; avoid trading or use for range-bound strategies.
Monitor the Table: Check the top-right table for real-time trend (Uptrend, Downtrend, Neutral) and volatility (High or Low) to confirm market context.
Unique Features
Adaptive Parameters: Automatically adjusts EMA lengths, RSI thresholds, and trading hours based on the selected market condition, reducing manual tweaking.
Neutral Zone Detection: Uses an ATR-based threshold to identify low-trend periods, helping traders avoid choppy markets.
Scaled RSI Visualization: Plots RSI and thresholds directly on the price chart, making it easier to assess momentum relative to price action.
Flexible Time Filtering: Supports both default and custom UTC-based trading windows, ideal for day traders targeting specific sessions.
Dynamic Cloud: Enhances trend visualization with customizable width and neutral zone coloring, improving readability.
Notes
Use on standard candlestick or bar charts to ensure realistic signals.
Test the indicator on a demo account to understand its behavior in your chosen market and timeframe.
Adjust settings to match your trading strategy, but avoid over-optimizing for past data.
The indicator is not a standalone system; combine it with other analysis (e.g., support/resistance, news events) for better results.
Limitations
Signals may lag in fast-moving markets due to EMA-based calculations.
Neutral zone detection may vary in extremely volatile or illiquid markets.
Time filters are UTC-based; ensure your platform’s timezone settings align.
This indicator is designed for traders seeking a customizable, trend-following tool that adapts to different market environments while providing clear visual cues and robust filtering.

CyberCandle SwiftEdgeCyberCandle SwiftEdge
Overview
CyberCandle SwiftEdge is a cutting-edge, AI-inspired trading indicator designed for traders seeking precision and clarity in trend-following and swing trading. Powered by SwiftEdge, it combines Heikin Ashi candles, a gradient-colored Exponential Moving Average (EMA), and a Relative Strength Index (RSI) to deliver clear buy and sell signals. Featuring glowing visuals, dynamic signal icons, and a customizable RSI dashboard in the top-right corner, this script offers a futuristic interface for identifying high-probability trade setups on various timeframes (e.g., 1H, 4H).
What It Does
CyberCandle SwiftEdge integrates three powerful components to generate actionable trading signals:
Heikin Ashi Candles: Smooths price action to highlight trends, reducing market noise and making reversals easier to spot.
Gradient EMA: A 100-period EMA with dynamic color transitions (blue/cyan for uptrends, red/pink for downtrends) to confirm market direction.
RSI Dashboard: A neon-lit display showing RSI levels, indicating overbought (>70), oversold (<30), or neutral (30-70) conditions.
Buy and sell signals are marked with prominent, glowing icons (triangles and arrows) based on trend direction, momentum, and specific Heikin Ashi patterns. The script’s customizable parameters allow traders to tailor the strategy to their preferences, balancing signal frequency and precision.
How It Works
The strategy leverages the synergy of Heikin Ashi, EMA, and RSI to filter trades and highlight opportunities:
Trend Direction: The price must be above the EMA for buy signals (bullish trend) or below for sell signals (bearish trend). The EMA’s gradient color shifts based on its slope, visually reinforcing trend strength.
Momentum Confirmation: RSI must exceed a user-defined threshold (default: 50) for buy signals or fall below it for sell signals, ensuring momentum supports the trade.
Candle Patterns: Buy signals require a green Heikin Ashi candle (close > open), with the two prior candles having minimal upper wicks (≤5% of candle body) and being red (indicating a retracement). Sell signals require a red candle, minimal lower wicks, and two prior green candles.
RSI Dashboard: Positioned in the top-right corner, it features a glowing circle (red for overbought, green for oversold, blue for neutral), the current RSI value, and a status indicator (triangle for extremes, square for neutral). This provides instant momentum insights without cluttering the chart.
By combining Heikin Ashi’s trend clarity, EMA’s directional filter, and RSI’s momentum validation, CyberCandle SwiftEdge minimizes false signals and highlights trades with strong potential. Its vibrant, AI-like visuals make it easy to interpret at a glance.
How to Use It
Add to Chart: In TradingView, search for "CyberCandle SwiftEdge" and add it to your chart. Set the chart to Heikin Ashi candles for optimal compatibility.
Interpret Signals:
Buy Signal: Large green triangles and arrows appear below candles when the price is above the EMA, RSI is above the buy threshold (default: 50), and conditions for a bullish retracement are met. Consider entering a long position with a 1:2 risk/reward ratio.
Sell Signal: Large red triangles and arrows appear above candles when the price is below the EMA, RSI is below the sell threshold (default: 50), and conditions for a bearish retracement are met. Consider entering a short position.
RSI Dashboard: Monitor the top-right dashboard. A red circle (RSI > 70) suggests caution for buys, a green circle (RSI < 30) indicates potential buying opportunities, and a blue circle (RSI 30-70) signals neutrality.
Customize Parameters: Open the indicator’s settings to adjust:
EMA Length (default: 100): Increase (e.g., 200) for longer-term trends or decrease (e.g., 50) for shorter-term sensitivity.
RSI Length (default: 14): Adjust for more (e.g., 7) or less (e.g., 21) responsive momentum signals.
RSI Buy/Sell Thresholds (default: 50): Set higher (e.g., 55) for buys or lower (e.g., 45) for sells to require stronger momentum.
Wick Tolerance (default: 0.05): Increase (e.g., 0.1) to allow larger wicks, generating more signals, or decrease (e.g., 0.02) for stricter conditions.
Require Retracement (default: true): Disable to remove the two-candle retracement requirement, increasing signal frequency.
Trading: Use signals in conjunction with the RSI dashboard and market context. For example, avoid buy signals if the RSI dashboard is red (overbought). Always apply proper risk management, such as setting stop-losses based on recent lows/highs.
What Makes It Original
CyberCandle SwiftEdge stands out due to its futuristic, AI-inspired visual design and user-friendly customization:
Neon Aesthetics: Glowing Heikin Ashi candles, gradient EMA, and dynamic signal icons (triangles and arrows) with RSI-driven transparency create a high-tech, immersive experience.
RSI Dashboard: A compact, top-right display with a neon circle, RSI value, and adaptive status indicator (triangle/square) provides instant momentum insights without cluttering the chart.
Customizability: Users can fine-tune EMA length, RSI parameters, wick tolerance, and retracement requirements via TradingView’s settings, balancing signal frequency and precision.
Integrated Approach: The synergy of Heikin Ashi’s trend clarity, EMA’s directional strength, and RSI’s momentum validation offers a cohesive strategy that reduces false signals.
Why This Combination?
The script combines Heikin Ashi, EMA, and RSI for a complementary effect:
Heikin Ashi smooths price fluctuations, making it ideal for identifying sustained trends and retracements, which are critical for the strategy’s signal logic.
EMA provides a reliable trend filter, ensuring signals align with the broader market direction. Its gradient color enhances visual trend recognition.
RSI adds momentum context, confirming that signals occur during favorable conditions (e.g., RSI > 50 for buys). The dashboard makes RSI intuitive, even for non-technical users.
Together, these components create a balanced system that captures trend reversals after retracements, validated by momentum, with a visually engaging interface that simplifies decision-making.
Tips
Best used on volatile assets (e.g., BTC/USD, EUR/USD) and higher timeframes (1H, 4H) for clearer trends.
Experiment with parameters in the settings to match your trading style (e.g., increase wick tolerance for more signals).
Combine with other analysis (e.g., support/resistance) for higher-confidence trades.
Note
This indicator is for informational purposes and does not guarantee profits. Always backtest and use proper risk management before trading.

Machine Learning RSI ║ BullVisionOverview:
Introducing the Machine Learning RSI with KNN Adaptation – a cutting-edge momentum indicator that blends the classic Relative Strength Index (RSI) with machine learning principles. By leveraging K-Nearest Neighbors (KNN), this indicator aims at identifying historical patterns that resemble current market behavior and uses this context to refine RSI readings with enhanced sensitivity and responsiveness.
Unlike traditional RSI models, which treat every market environment the same, this version adapts in real-time based on how similar past conditions evolved, offering an analytical edge without relying on predictive assumptions.
Key Features:
🔁 KNN-Based RSI Refinement
This indicator uses a machine learning algorithm (K-Nearest Neighbors) to compare current RSI and price action characteristics to similar historical conditions. The resulting RSI is weighted accordingly, producing a dynamically adjusted value that reflects historical context.
📈 Multi-Feature Similarity Analysis
Pattern similarity is calculated using up to five customizable features:
RSI level
RSI momentum
Volatility
Linear regression slope
Price momentum
Users can adjust how many features are used to tailor the behavior of the KNN logic.
🧠 Machine Learning Weight Control
The influence of the machine learning model on the final RSI output can be fine-tuned using a simple slider. This lets you blend traditional RSI and machine learning-enhanced RSI to suit your preferred level of adaptation.
🎛️ Adaptive Filtering
Additional smoothing options (Kalman Filter, ALMA, Double EMA) can be applied to the RSI, offering better visual clarity and helping to reduce noise in high-frequency environments.
🎨 Visual & Accessibility Settings
Custom color palettes, including support for color vision deficiencies, ensure that trend coloring remains readable for all users. A built-in neon mode adds high-contrast visuals to improve RSI visibility across dark or light themes.
How It Works:
Similarity Matching with KNN:
At each candle, the current RSI and optional market characteristics are compared to historical bars using a KNN search. The algorithm selects the closest matches and averages their RSI values, weighted by similarity. The more similar the pattern, the greater its influence.
Feature-Based Weighting:
Similarity is determined using normalized values of the selected features, which gives a more refined result than RSI alone. You can choose to use only 1 (RSI) or up to all 5 features for deeper analysis.
Filtering & Blending:
After the machine learning-enhanced RSI is calculated, it can be optionally smoothed using advanced filters to suppress short-term noise or sharp spikes. This makes it easier to evaluate RSI signals in different volatility regimes.
Parameters Explained:
📊 RSI Settings:
Set the base RSI length and select your preferred smoothing method from 10+ moving average types (e.g., EMA, ALMA, TEMA).
🧠 Machine Learning Controls:
Enable or disable the KNN engine
Select how many nearest neighbors to compare (K)
Choose the number of features used in similarity detection
Control how much the machine learning engine affects the RSI calculation
🔍 Filtering Options:
Enable one of several advanced smoothing techniques (Kalman Filter, ALMA, Double EMA) to adjust the indicator’s reactivity and stability.
📏 Threshold Levels:
Define static overbought/oversold boundaries or reference dynamically adjusted thresholds based on historical context identified by the KNN algorithm.
🎨 Visual Enhancements:
Select between trend-following or impulse coloring styles. Customize color palettes to accommodate different types of color blindness. Enable neon-style effects for visual clarity.
Use Cases:
Swing & Trend Traders
Can use the indicator to explore how current RSI readings compare to similar market phases, helping to assess trend strength or potential turning points.
Intraday Traders
Benefit from adjustable filters and fast-reacting smoothing to reduce noise in shorter timeframes while retaining contextual relevance.
Discretionary Analysts
Use the adaptive OB/OS thresholds and visual cues to supplement broader confluence zones or market structure analysis.
Customization Tips:
Higher Volatility Periods: Use more neighbors and enable filtering to reduce noise.
Lower Volatility Markets: Use fewer features and disable filtering for quicker RSI adaptation.
Deeper Contextual Analysis: Increase KNN lookback and raise the feature count to refine pattern recognition.
Accessibility Needs: Switch to Deuteranopia or Monochrome mode for clearer visuals in specific color vision conditions.
Final Thoughts:
The Machine Learning RSI combines familiar momentum logic with statistical context derived from historical similarity analysis. It does not attempt to predict price action but rather contextualizes RSI behavior with added nuance. This makes it a valuable tool for those looking to elevate traditional RSI workflows with adaptive, research-driven enhancements.

Trend Confirmation StrategyComprehensive Trend Confirmation System
Indicator Features (Professional Description):
Comprehensive Trend Confirmation System is a versatile indicator meticulously designed to identify and confirm trend-based trading opportunities with exceptional efficiency. By seamlessly integrating analysis from a suite of leading technical tools, it aims to provide superior accuracy and reliability for informed trading decisions.
Key Features:
Intelligent Trend Identification: A robust trend analysis system that considers:
Adjustable Moving Averages: Utilizes three customizable moving average periods (fast, medium, slow) with user-selectable lengths and types (SMA, EMA, WMA, VWMA) to accurately determine the prevailing trend across different timeframes.
In-depth Price Action Analysis: Examines the formation of Higher Highs/Higher Lows (uptrend) and Lower Highs/Lower Lows (downtrend) to validate price direction.
Average Directional Index (ADX) with Adjustable Threshold: Measures the strength of a trend and employs the comparison between +DI and -DI to pinpoint the dominant momentum, featuring a customizable threshold to filter out weak signals.
Multi-Factor Signal Confirmation System: Enhances the reliability of trading signals through verification from four distinct confirmation tools:
Volume Analysis with Average Reference: Assesses whether trading volume supports price movements by comparing it to historical averages.
Relative Strength Index (RSI) with Reference Levels: Measures price momentum and identifies overbought/oversold conditions to confirm trend strength.
Moving Average Convergence Divergence (MACD) Divergence and Crossovers: Detects shifts in momentum and potential trend changes through the relationship between the MACD line and the Signal line.
Stochastic Oscillator with Reference Levels: Measures the current price's position relative to its historical range to evaluate overbought/oversold conditions and potential reversal opportunities.
Intelligent Signal Generation Logic:
Buy Signal: Triggered when a strong uptrend is identified (meeting defined criteria) and confirmed by at least three out of the four confirmation tools.
Sell Signal: Triggered when a strong downtrend is identified (meeting defined criteria) and confirmed by at least three out of the four confirmation tools.
User-Friendly Visualizations:
Moving Averages (MA): Displays three MA lines on the chart with user-configurable colors (default: fast-blue, medium-orange, slow-red) for easy visual trend analysis.
Clear Buy and Sell Signal Symbols: Presents distinct green upward-pointing triangles for buy signals and red downward-pointing triangles for sell signals at the corresponding candlestick.
Dynamic Candlestick Color Coding: Candlesticks are dynamically colored green upon a buy signal and red upon a sell signal for quick identification of trading opportunities.
Highly Customizable Parameters: Users have extensive control over the indicator's parameters, including:
Lengths and types of Moving Averages.
Length and Threshold of the ADX.
Length of the RSI.
Parameters for the MACD (Fast Length, Slow Length, Signal Length).
Parameters for the Stochastic Oscillator (%K Length, %D Length, Smoothing).
Ideal For:
Traders seeking a robust tool to accurately identify and confirm market trends.
Individuals aiming to reduce false signals and enhance the precision of their trading decisions.
Traders employing trend-following strategies in markets with clear directional movement.
Important Note:
While Comprehensive Trend Confirmation System is engineered to improve trading accuracy, no indicator can guarantee 100% profitable trades. Users are advised to utilize this indicator in conjunction with relevant fundamental analysis and sound risk management practices for optimal trading outcomes.

RSI Candles with EMA byAuncleJoeThe Relative Strength Index (RSI) is one of the most widely used momentum indicators in trading. It helps traders assess whether an asset is overbought or oversold by measuring the speed and magnitude of recent price changes. Traditionally, RSI is displayed as a single line oscillating between 0 and 100, but this representation can sometimes make it difficult to spot trends, reversals, and momentum shifts effectively.
To enhance RSI visualization and usability, the RSI Candles with EMA indicator transforms the RSI values into candlestick charts, providing a more intuitive and dynamic way to analyze momentum. Unlike the traditional RSI line, this approach allows traders to observe RSI trends just as they would analyze price charts, making it easier to detect changes in momentum and trend strength.
Each RSI candle represents a specific period’s momentum activity. Green candles indicate that the RSI closed higher than it opened, signaling bullish momentum, while red candles suggest that the RSI closed lower than it opened, indicating bearish sentiment. This candlestick-style visualization helps traders spot RSI trends, breakouts, and reversals more effectively than a simple line chart.
To further refine momentum analysis, this indicator also includes an Exponential Moving Average (EMA) of RSI. The EMA smooths RSI fluctuations and provides a clearer trend direction. When RSI candles remain above the EMA, it suggests strong buying momentum, whereas RSI candles falling below the EMA indicate increasing selling pressure. This combination of RSI candlesticks and an EMA line allows traders to better identify shifts in market sentiment and potential trend reversals.
Additionally, the indicator includes customizable overbought and oversold levels (defaulted at 70 and 30, respectively). These levels help traders recognize when an asset might be overextended in either direction, potentially signaling an upcoming reversal. When RSI candles approach or cross these thresholds, traders can anticipate possible changes in market direction.
This indicator is particularly useful for a wide range of traders. Scalpers and day traders can leverage it to quickly identify short-term momentum shifts, while swing traders can use it to detect potential reversals in multi-day trends. Trend-following traders can confirm bullish or bearish trends based on RSI’s position relative to its EMA, and mean reversion traders can use it to spot extreme conditions where price action might snap back.
By combining RSI candlesticks with an EMA filter, this indicator provides a more dynamic and visually intuitive approach to momentum trading. It offers clearer trend signals, better reversal detection, and enhanced decision-making, making it an essential tool for traders who rely on RSI-based strategies.

Custom TABI Model with LayersCustom Top and Bottom Indicator (TABI) (Is a Trend Adaptive Blow-Off Indicator) -
User Guide & Description
Introduction
The TABI (Trend Adaptive Blow-Off Indicator) is a refined, multi-layered RSI tool designed to enhance trend analysis, detect momentum shifts, and highlight overbought/oversold conditions with a more nuanced, color-coded approach. This indicator is useful for traders seeking to identify key reversal points, confirm trend strength, and filter trade setups more effectively than traditional RSI.
By incorporating volume-based confirmation and divergence detection, TABI aims to reduce false signals and improve trade timing.
How It Works
TABI builds on the Relative Strength Index (RSI) by introducing:
A smoothed RSI calculation for better trend readability.
11 color-coded RSI levels, allowing traders to visually distinguish weak, neutral, and extreme conditions.
Volume-based confirmation to detect high-conviction moves.
Bearish & Bullish Divergence Detection, inspired by Market Cipher methods, to spot potential reversals early.
Overbought & Oversold alerts, with optional candlestick color changes to highlight trade signals.
Key Features
✅ Color-Coded RSI for Better Readability
The RSI is divided into multi-layered color zones:
🔵 Light Blue: Extremely oversold
🟢 Lime Green: Mild oversold, potential trend reversal
🟡 Yellow & Orange: Neutral, momentum consolidation
🟠 Dark Orange: Caution, overbought conditions developing
🔴 Red: Extreme overbought, possible exhaustion
✅ Divergence Detection
Bearish Divergence: Price makes higher highs, RSI makes lower highs → Potential top signal
Bullish Divergence: Price makes lower lows, RSI makes higher lows → Potential bottom signal
✅ Volume Confirmation Filter
Requires a 50% above-average volume spike for strong buy/sell signals, reducing false breakouts.
✅ Dynamic Labels & Alerts
🚨 Blow-Off Top Warning: If RSI is overbought + volume spikes + divergence detected
🟢 Oversold Bottom Alert: If RSI is oversold + bullish divergence
Candlestick color changes when extreme conditions are met.
How to Use
📌 Entry & Exit Signals
Buy Consideration:
RSI enters Green Zone (oversold)
Bullish divergence detected
Volume confirms the move
Sell Consideration:
RSI enters Red Zone (overbought)
Bearish divergence detected
Volume confirms exhaustion
📌 Trend Confirmation
Use the yellow/orange levels to confirm strong trends before entering counter-trend trades.
📌 Filtering Trade Noise
The RSI smoothing helps reduce false whipsaws, making it easier to read true momentum shifts.
Customization Options
🔧 User-Defined RSI Thresholds
Adjust the overbought/oversold levels to match your trading style.
🔧 Divergence Sensitivity
Modify the lookback period to fine-tune divergence detection accuracy.
🔧 Volume Thresholds
Set custom volume multipliers to control confirmation requirements.
Why This is Unique
🔹 Unlike traditional RSI, TABI visually maps RSI zones into layered gradients, making it easy to spot momentum shifts.
🔹 The multi-layered color scheme adds an intuitive, heatmap-like effect to RSI, helping traders quickly gauge conditions.
🔹 Incorporates CCF-inspired divergence detection and volume filtering, making signals more robust.
🔹 Dynamic labeling system ensures clarity without cluttering the chart.
Alerts & Notifications
🔔 TradingView Alerts Included
🚨 Blow-Off Top Detected → RSI overbought + volume spike + bearish divergence.
🟢 Oversold Bottom Detected → RSI oversold + bullish divergence.
Set alerts to receive notifications without watching the charts 24/7.
Final Thoughts
TABI is designed to simplify RSI analysis, provide better trade signals, and improve decision-making. Whether you're day trading, swing trading, or long-term investing, this tool helps you navigate market conditions with confidence.
🔥 Use it to detect high-probability reversals, confirm trends, and improve trade entries/exits! 🚀

Dynamic RSI Bollinger Bands with Waldo Cloud
TradingView Indicator Description: Dynamic RSI Bollinger Bands with Waldo Cloud
Title: Dynamic RSI Bollinger Bands with Waldo Cloud
Short Title: Dynamic RSI BB Waldo
Overview:
Introducing an experimental indicator, the Dynamic RSI Bollinger Bands with Waldo Cloud, designed for adventurous traders looking to explore new dimensions in technical analysis. This indicator overlays on your chart, providing a unique perspective by integrating the Relative Strength Index (RSI) with Bollinger Bands, creating a dynamic trading tool that adapts to market conditions through the lens of momentum and volatility.
What is it?
This innovative indicator combines the traditional Bollinger Bands with the RSI in a way that hasn't been commonly explored. Here's a breakdown:
RSI Integration: The RSI is calculated with customizable length settings, and its values are used not just for momentum analysis but as the basis for the Bollinger Bands. This means the position and width of the bands are directly influenced by the RSI, offering a visual representation of momentum within the context of price volatility.
Dynamic Bollinger Bands: Instead of using price directly, the Bollinger Bands are calculated using a scaled version of the RSI. This scaling is done to fit the RSI values into the price range, ensuring the bands are relevant to the actual price movement. The standard deviation for these bands is also scaled accordingly, providing a unique volatility measure that's momentum-driven.
Waldo Cloud: Named after a visual representation concept, the 'Waldo Cloud' refers to the colored area between the Bollinger Bands, which changes based on various conditions:
Purple when RSI is overbought.
Blue when RSI is oversold.
Green for bullish conditions, defined by the fast-moving average crossing above the slow one, RSI is bullish, and the price is above the slow MA.
Red for bearish conditions, when the fast MA crosses below the slow MA, the RSI is bearish, and the price is below the slow MA.
Gray for neutral market conditions.
Moving Averages: Two simple moving averages (Fast MA and Slow MA) are included, which can be toggled on or off, offering additional trend analysis through crossovers.
How to Use It:
Given its experimental nature, this indicator should be used with caution and in conjunction with other analysis methods:
Identifying Market Conditions: Use the color of the Waldo Cloud to gauge market sentiment. A green cloud might suggest a good time to consider long positions, while a red cloud could indicate potential shorting opportunities. Purple and blue clouds highlight extreme conditions that might precede reversals.
Volatility and Momentum: The dynamic nature of the Bollinger Bands based on RSI provides insight into how momentum is affecting price volatility. When the bands are wide, it might indicate high momentum and potential trend continuation or reversal, depending on the RSI's position relative to its overbought/oversold levels.
Trend Confirmation: The moving average crossovers can act as confirmation signals. For instance, a bullish crossover (fast MA over slow MA) within a green cloud might strengthen a buy signal, whereas a bearish crossover in a red cloud might reinforce a sell decision.
Customization: Adjust the RSI length, overbought/oversold levels, and moving average lengths to suit different trading styles or market conditions. Experiment with these settings to find what works best for your strategy.
Combining with Other Indicators: Since this is an experimental tool, it's advisable to use it alongside established indicators like traditional Bollinger Bands, MACD, or trend lines to validate signals.
Conclusion:
The Dynamic RSI Bollinger Bands with Waldo Cloud is an experimental venture into combining momentum with volatility visually and interactively. It's designed for traders who are open to exploring new methods of market analysis.
Remember, due to its experimental status, this indicator should be part of a broader trading strategy, and backtesting or paper trading is recommended before applying it in live trading scenarios. Keep an eye on how the market reacts to the signals provided by this indicator and always consider risk management practices.

RSI Crossover dipali parikhThis script generates buy and sell signals based on the crossover of the Relative Strength Index (RSI) and the RSI-based Exponential Moving Average (EMA). It also includes an additional condition for both buy and sell signals that the RSI-based EMA must be either above or below 50.
Key Features:
Buy Signal: Triggered when:
The RSI crosses above the RSI-based EMA.
The RSI-based EMA is above 50.
A green "BUY" label will appear below the bar when the buy condition is met.
Sell Signal: Triggered when:
The RSI crosses below the RSI-based EMA.
The RSI-based EMA is below 50.
A red "SELL" label will appear above the bar when the sell condition is met.
Customizable Inputs:
RSI Length: Adjust the period for calculating the RSI (default is 14).
RSI-based EMA Length: Adjust the period for calculating the RSI-based EMA (default is 9).
RSI Threshold: Adjust the threshold (default is 50) for when the RSI-based EMA must be above or below.
Visuals:
The RSI is plotted as a blue line.
The RSI-based EMA is plotted as an orange line.
Buy and sell signals are indicated by green "BUY" and red "SELL" labels.
Alerts:
Alerts can be set for both buy and sell conditions to notify you when either condition is met.
How to Use:
Use this script to identify potential buy and sell opportunities based on the behavior of the RSI relative to its EMA.
The buy condition indicates when the RSI is strengthening above its EMA, and the sell condition signals when the RSI is weakening below its EMA.
Strategy Use:
Ideal for traders looking to leverage RSI momentum for entering and exiting positions.
The RSI-based EMA filter helps smooth out price fluctuations, focusing on stronger signals.
This script is designed for both discretionary and algorithmic traders, offering a simple yet effective method for spotting trend reversals and continuation opportunities using RSI.

Double RSIDouble RSI (DRSI) Indicator
The Double RSI (DRSI) is a technical analysis tool designed to provide traders with enhanced buy and sell signals by identifying uptrend and downtrend thresholds. It refines traditional RSI-based signals by applying a "double calculation" to the Relative Strength Index (RSI), improving precision in detecting trend changes.
Key Concepts Behind the Indicator
1. Double RSI Calculation
The DRSI indicator takes the standard RSI (calculated using the closing price over a specified length) and applies a second RSI calculation to it. This creates a smoother, more refined RSI value, making it more effective at highlighting the general trend of the market.
RSI: Measures the strength of recent price movements, ranging from 0 to 100.
Double RSI (DRSI): Applies the RSI formula to the RSI values themselves, smoothing out fluctuations and generating clearer signals.
How Does the Indicator Work?
The DRSI identifies uptrends and downtrends using two user-defined thresholds:
Uptrend Threshold (Default = 59): A value above this threshold signals a potential shift into an uptrend.
Downtrend Threshold (Default = 52): A value below this threshold signals a potential shift into a downtrend.
Signal Generation
Buy Signal: A crossover occurs when the DRSI value crosses above the Downtrend Threshold, signaling the beginning of an upward movement.
Sell Signal: A crossunder occurs when the DRSI value crosses below the Uptrend Threshold, signaling the beginning of a downward movement.
Customizable Inputs
The indicator offers customizable settings for increased flexibility:
DRSI Length (Default = 13): Determines the lookback period for RSI calculations. A shorter length increases sensitivity, while a longer length smooths the signals.
Uptrend Threshold (Default = 59): Sets the level above which an uptrend is confirmed.
Downtrend Threshold (Default = 52): Sets the level below which a downtrend is confirmed.
Bar Color and Glow Effects: Traders can enable colored candles or glowing DRSI lines for better visual representation.
Why is This Indicator Useful for Traders?
1. Noise Reduction
By applying a second RSI calculation, the DRSI smooths out minor fluctuations and highlights the overall trend.
2. Clear Uptrend and Downtrend Signals
The indicator provides intuitive buy (green arrow) and sell (red arrow) markers, simplifying decision-making.
3. Customizable Thresholds
Traders can adjust the thresholds and length to better suit specific trading strategies or market conditions.
4. Bar Coloring
Bars are color-coded to indicate the trend:
Green (Above Uptrend Threshold): Indicates an uptrend.
Red (Below Downtrend Threshold): Indicates a downtrend.
How the Indicator Appears on the Chart
DRSI Line: A smooth line derived from the double RSI calculation.
Threshold Lines: Two horizontal lines (green for the Uptrend Threshold, red for the Downtrend Threshold) to visualize trend changes.
Colored Candles: Candlesticks dynamically change color based on the trend direction (green for uptrends, red for downtrends).
Buy/Sell Markers:
Buy Signal: A green upward triangle below the bar, marking the start of an uptrend.
Sell Signal: A red downward triangle above the bar, marking the start of a downtrend.
In Summary
The Double RSI (DRSI) indicator is a powerful tool for identifying uptrends and downtrends with:
Smoothed trend detection using double-calculated RSI values.
Clear, actionable buy and sell signals.
Customizable settings to match different trading styles.
By focusing on trend thresholds rather than overbought or oversold levels, the DRSI provides traders with precise, noise-free signals to optimize their trading decisions.

RSI + Normalized Fisher Transform with SignalsThis indicator combines three tools for market analysis: the Relative Strength Index (RSI), the RSI's moving average, and the Fisher Transform. RSI is a momentum oscillator that measures the speed and change of price movements, helping identify overbought and oversold conditions. The RSI moving average is a smoothed version of the RSI that filters noise and confirms trends. The Fisher Transform is a mathematical technique that transforms price data into a Gaussian normal distribution, making it easier to identify turning points. It has been normalized to the same scale as the RSI (0-100) for consistency.
Purpose
The goal of this indicator is to identify potential buy and sell opportunities with varying degrees of strength (strong and weak). By combining the RSI, its moving average, and the Fisher Transform, the indicator ensures signals are based on both momentum and reversals, making it highly versatile across different market conditions.
Key Features
This indicator provides strong and weak buy and sell signals. A strong buy occurs when the RSI crosses above its moving average while both the RSI and its moving average are oversold (below the default threshold of 30), and the Fisher Transform reverses direction within the same or prior bar while also being oversold. A weak buy occurs when the Fisher Transform is oversold, and the RSI crosses above its moving average while its value is between the default oversold threshold (30) and 50. A strong sell occurs when the RSI crosses below its moving average while both the RSI and its moving average are overbought (above the default threshold of 70), and the Fisher Transform reverses direction within the same or prior bar while also being overbought. A weak sell occurs when the Fisher Transform is overbought, and the RSI crosses below its moving average while its value is between 50 and the default overbought threshold (70).
The indicator includes customizable thresholds and lengths. Users can adjust the oversold and overbought thresholds to suit their trading style. The RSI length, moving average length, and Fisher Transform length are also customizable. The Fisher Transform is scaled to the RSI’s range of 0-100 to simplify analysis and signal interpretation.
How to Use the Indicator
On the chart, you will see the RSI line in blue, the RSI moving average in orange, and the Fisher Transform in purple. Horizontal lines at the default oversold (30) and overbought (70) levels mark critical zones for signals. Adjust these thresholds in the indicator settings as needed.
Strong buy signals are shown as larger, darker green arrows below the price. Weak buy signals are small lime arrows below the price. Strong sell signals are larger, darker red arrows above the price. Weak sell signals are small fuchsia arrows above the price.
Signal Interpretation
A strong buy indicates a highly favorable buying opportunity. This typically occurs when the asset is in a downtrend but shows signs of reversal, particularly in oversold zones. A weak buy suggests a potential buying opportunity but with less conviction, often when the market is neutral to slightly bearish but showing upward momentum. A strong sell indicates a highly favorable selling opportunity, usually occurring when the asset is in an uptrend but shows signs of reversal, particularly in overbought zones. A weak sell suggests a potential selling opportunity but with less conviction, often in neutral to slightly bullish markets showing downward momentum.
Practical Tips
Avoid using signals in isolation. Combine this indicator with other tools such as trendlines, moving averages, or support/resistance levels for greater accuracy. Adjust the parameters for different assets to match their volatility. For volatile assets, consider wider thresholds like 20/80 for oversold/overbought levels. For less volatile assets, tighter thresholds like 35/65 may be more appropriate. Use higher timeframes to confirm signals before trading on lower timeframes. Be cautious in sideways markets, as both RSI and the Fisher Transform perform better in trending conditions.
Instructions for Adjustments
To change the oversold or overbought levels, open the indicator settings by clicking the gear icon and modify the "Oversold Threshold" and "Overbought Threshold" values. To adjust lengths for RSI and Fisher Transform, update the "RSI Length," "RSI Moving Average Length," and "Fisher Transform Length" settings. If needed, toggle signal visibility by enabling or disabling specific arrows (Strong Buy, Weak Buy, Strong Sell, Weak Sell) in the "Style" tab.
Best Practices
Risk management is essential. Always set appropriate stop-loss levels and position sizes based on your risk tolerance. Backtest the indicator on historical data to understand its performance and behavior for your chosen asset and timeframe. Combining this indicator with volume or volatility analysis (Bollinger Band Width, for example) can help confirm signal validity.
This indicator simplifies decision-making by identifying high-probability trading opportunities using a combination of momentum, trend, and reversals. Follow these instructions to fully utilize its capabilities without needing to analyze the underlying code.

MTF RSI+CMO PROThis RSI+CMO script combines the Relative Strength Index (RSI) and Chande Momentum Oscillator (CMO), providing a powerful tool to help traders analyze price momentum and spot potential turning points in the market. Unlike using RSI alone, the CMO (especially with a 14-period length) moves faster and accentuates price pops and dips in the histogram, making price shifts more apparent.
Indicator Features:
➡️RSI and CMO Combined: This indicator allows traders to track both RSI and CMO values simultaneously, highlighting differences in their movement. RSI and CMO values are both plotted on the histogram, while CMO values are also drawn as a line moving through the histogram, giving a visual representation of their relationship. The often faster-moving CMO accentuates short-term price movements, helping traders spot subtle shifts in momentum that the RSI might smooth out.
➡️Multi-Time Frame Table: A real-time, multi-time frame table displays RSI and CMO values across various timeframes. This gives traders an overview of momentum across different intervals, making it easier to spot trends and divergences across short and long-term time frames.
➡️Momentum Chart Label: A chart label compares the current RSI and CMO values with values from 1 and 2 bars back, providing an additional metric to gauge momentum. This feature allows traders to easily see if momentum is increasing or decreasing in real-time.
➡️RSI/CMO Bullish and Bearish Signals: Colored arrow plot shapes (above the histogram) indicate when RSI and CMO values are signaling bullish or bearish conditions. For example, green arrows appear when RSI is above 65, while purple arrows show when RSI is below 30 and CMO is below -40, indicating strong bearish momentum.
➡️Divergences in Histogram: The histogram can make it easier for traders to spot divergences between price and momentum. For instance, if the price is making new highs but the RSI or CMO is not, a bearish divergence may be forming. Similarly, bullish divergences can be spotted when prices are making lower lows while RSI or CMO is rising.
➡️Alert System: Alerts are built into the indicator and will trigger when specific conditions are met, allowing traders to stay informed of potential entry or exit points based on RSI and CMO levels without constantly monitoring the chart. These are set manually. Look for the 3 dots in the indicator name.
How Traders Can Use the Indicator:
💥Identifying Momentum Shifts: The RSI+CMO combination is ideal for spotting momentum shifts in the market. Traders can monitor the histogram and the CMO line to determine if the market is gaining or losing strength.
💥Confirming Trade Entries/Exits: Use the real-time RSI and CMO values across multiple time frames to confirm trades. For instance, if the 1-hour RSI is above 70 but the 1-minute RSI is turning down, it could indicate short-term overbought conditions, signaling a potential exit or reversal.
💥Spotting Divergences: Divergences are critical for predicting potential reversals. The histogram can be used to spot divergences when RSI and CMO values deviate from price action, offering an early signal of market exhaustion.
💥Tracking Multi-Time Frame Trends: The multi-time frame table provides insight into the market’s overall trend across several timeframes, helping traders ensure their decisions align with both short and long-term trends.
RSI vs. CMO: Why Use Both?
While both RSI and CMO measure momentum, the CMO often moves faster with a value of 14 for example, reacting to price changes more quickly. This makes it particularly effective for detecting sharp price movements, while RSI helps smooth out price action. By using both, traders get a clearer picture of the market's momentum, particularly during volatile periods.
Confluence and Price Fluidity:
One of the powerful ways to enhance the effectiveness of this indicator is by using it in conjunction with other technical analysis tools to create confluence. Confluence occurs when multiple indicators or price action signals align, providing stronger confirmation for a trade decision. For example:
🎯Support and Resistance Levels: Traders can use RSI+CMO in combination with key support and resistance zones. If the price is nearing a support level and RSI+CMO values start to signal a bullish reversal, this alignment strengthens the case for entering a long position.
🎯Moving Averages: When the RSI+CMO signals a potential trend reversal and this is confirmed by a crossover in moving averages (such as a 50-day and 200-day moving average), traders gain additional confidence in the trade direction.
🎯Momentum Indicators: Traders can also look for momentum indicators like the MACD to confirm the strength of a trend or potential reversal. For instance, if the RSI+CMO values start to decrease rapidly while both the RSI+CMO also shows overbought conditions, this could provide stronger confirmation to exit a long trade or enter a short position.
🎯Candlestick Patterns: Price fluidity can be monitored using candlestick formations. For example, a bearish engulfing pattern with decreasing RSI+CMo values offers confluence, adding confidence to the signal to close or short the trade.
By combining the MTF RSI+CMO PRO with other tools, traders ensure that they are not relying on a single indicator. This layered approach can reduce the likelihood of false signals and improve overall trading accuracy.

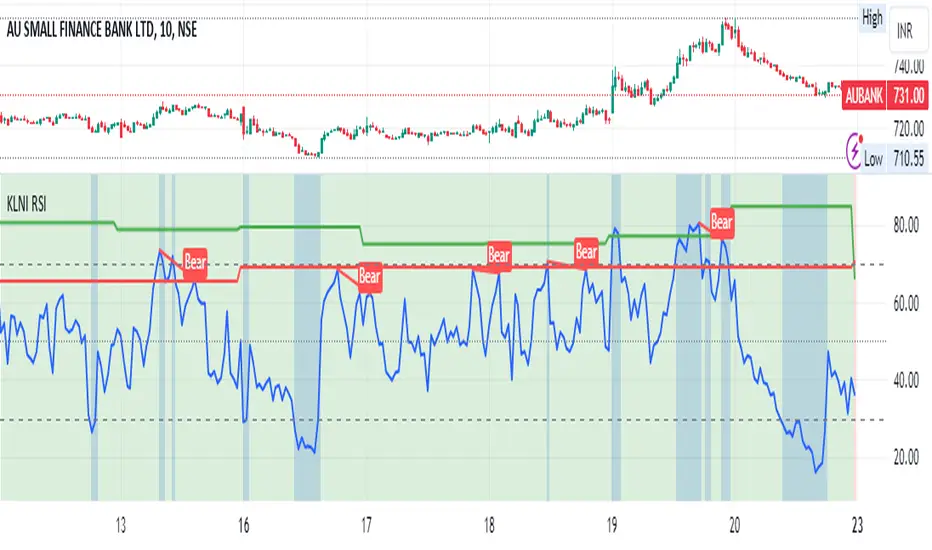
KLNI RSI MTFDescription of the RSI Multi-Timeframe Indicator
The RSI Multi-Timeframe Indicator allows you to track and compare the Relative Strength Index (RSI) across three different timeframes on the same chart. This is particularly useful for traders who want to gauge the momentum of an asset over multiple time periods simultaneously, helping to make more informed trading decisions.
Key Features
Multi-Timeframe RSI:
You can select up to three timeframes to plot RSI on the same chart.
Available timeframe options include:
Current: Displays RSI for the current chart timeframe.
60 minutes (1 hour)
Daily
Weekly
Monthly
Custom RSI Settings:
Adjust the RSI length and source (e.g., close price) through user inputs, allowing you to tailor the indicator to your strategy.
Divergence Detection (Optional):
The indicator can optionally detect and display bullish and bearish divergences between price and RSI for the first selected timeframe.
Bullish divergence is shown when price makes a lower low, but RSI makes a higher low.
Bearish divergence is shown when price makes a higher high, but RSI makes a lower high.
Visual Aids:
Overbought and oversold RSI levels are highlighted with background colors for clarity.
Horizontal lines at 70 (overbought), 50 (neutral), and 30 (oversold) help quickly identify RSI conditions.
How to Use This Indicator
Inputs & Settings
Timeframe Settings:
First Timeframe: Choose the primary timeframe (e.g., 60 minutes, Daily, Weekly).
Second Timeframe: Select the second timeframe to plot on the chart.
Third Timeframe: Select the third timeframe for additional RSI analysis.
RSI Settings:
RSI Length: Set the period for RSI calculation (default: 14).
Source: Select the price data for RSI calculation (default: close price).
Show Divergence: Enable or disable the detection of divergence between price and RSI.
Plotting on Chart
The indicator will display three distinct RSI plots for the selected timeframes:
RSI TF1 (blue line) for the first timeframe.
RSI TF2 (green line) for the second timeframe.
RSI TF3 (red line) for the third timeframe.
Each RSI line corresponds to its chosen timeframe, allowing you to see how RSI behaves across different time periods.
Reading the RSI Values
Overbought: When RSI is above 70, the asset is considered overbought, potentially signaling a sell or short entry.
Oversold: When RSI is below 30, the asset is considered oversold, possibly indicating a buying opportunity.
Neutral: RSI around 50 is neutral and may suggest a lack of clear momentum.
Divergence Detection
If enabled, the indicator will highlight points of divergence:
Bullish Divergence: A green label will appear below the chart where price is making lower lows, but RSI is making higher lows, suggesting potential bullish momentum.
Bearish Divergence: A red label will appear when price is making higher highs, but RSI is making lower highs, indicating potential bearish pressure.
Practical Applications
Momentum Confirmation: Use this indicator to confirm the strength of a trend by comparing RSI across multiple timeframes. For example, if RSI is above 50 on all three timeframes, it may confirm strong upward momentum.
Overbought/Oversold Signals: When RSI is overbought on multiple timeframes, it could signal an impending reversal or correction. Conversely, oversold conditions across timeframes might indicate a buy opportunity.
Divergence Detection: Spot divergence between price and RSI to identify potential trend reversals early. Divergence can provide early signals of changing market momentum.
Summary
This indicator is a powerful tool for multi-timeframe RSI analysis, helping traders understand momentum shifts across different timeframes. It offers customizability, divergence detection, and visual aids to streamline your technical analysis and decision-making process.
Market Structure RSIDescription:
The Market Structure RSI is an innovative indicator that combines the power of the Relative Strength Index (RSI) with market structure analysis to provide a unique perspective on the market. This indicator helps traders identify potential trend reversals and trading opportunities by analyzing the underlying market structure and generating overbought and oversold signals.
Key Features:
RSI Calculation: The indicator calculates a custom RSI based on the market structure, taking into account the formation of higher highs and lower lows. This unique approach to RSI calculation provides a more accurate representation of the market's strength and weakness.
Overbought and Oversold Levels: Users can customize the overbought and oversold levels according to their preferences. When the Market Structure RSI crosses above the oversold level, it generates a bullish signal, suggesting a potential long entry. Conversely, when the RSI crosses below the overbought level, it generates a bearish signal, indicating a potential short entry.
Moving Average: The indicator includes an optional moving average of the Market Structure RSI, which can be used to smooth out the RSI line and provide additional confirmation of trend reversals. Users can choose between EMA, SMA, and WMA and adjust the length of the moving average.
Customizable Close Type: The indicator allows users to define whether the market structure is deemed broken based on the candle close or the candle high/low. This flexibility enables traders to adapt the indicator to their preferred trading style and market conditions.
Visual Enhancements: The Market Structure RSI features gradient fills between the RSI line and the overbought/oversold levels, providing a clear visual representation of the market's strength. Additionally, the indicator plots bullish and bearish signals as circles on the RSI line, making it easy to identify potential entry points.
How to Use:
Add the Market Structure RSI to your chart and customize the settings according to your preferences, such as the RSI length, overbought and oversold levels, and moving average type and length.
Monitor the Market Structure RSI for crossovers above the oversold level or below the overbought level. A bullish signal occurs when the RSI crosses above the oversold level, while a bearish signal occurs when the RSI crosses below the overbought level.
Use the signals generated by the Market Structure RSI in conjunction with other technical analysis tools and price action patterns to confirm potential trade entries. The indicator works well as a complementary tool to support your existing trading strategy.
Consider the overall trend and market context when interpreting the signals generated by the Market Structure RSI. The indicator is most effective in trending markets and may produce less reliable signals in choppy or ranging market conditions.
Utilize sound risk management principles, such as setting appropriate stop-loss and take-profit levels, when trading based on the Market Structure RSI signals.
The Market Structure RSI offers a fresh perspective on the classic RSI indicator by incorporating market structure analysis. By combining the power of RSI with the identification of higher highs and lower lows, this indicator provides traders with a valuable tool for identifying potential trend reversals and trading opportunities. Whether you are a seasoned trader or just starting out, the Market Structure RSI can be a valuable addition to your technical analysis toolkit.

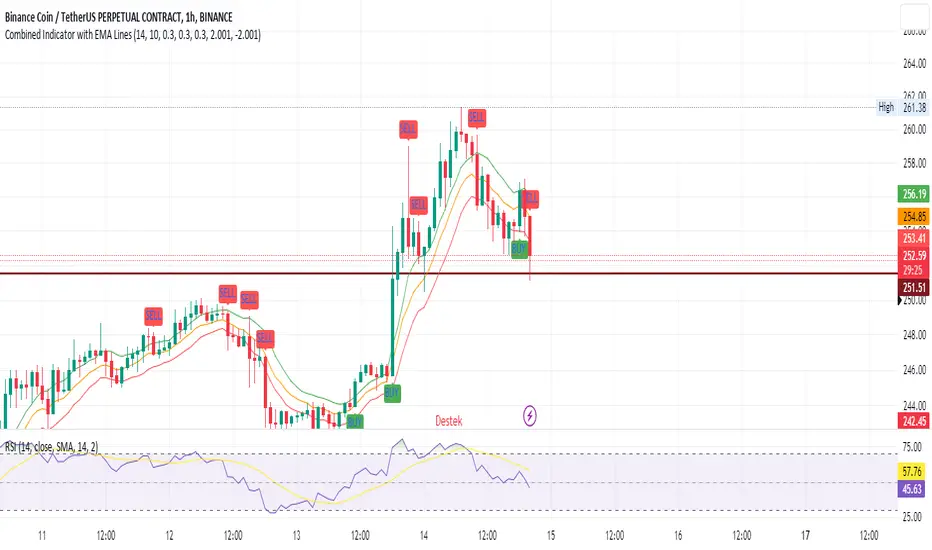
SEC-Combined Indicator with EMA LinesTitle: Combined Indicator with EMA Lines
Description:
The Combined Indicator with EMA Lines is a technical analysis tool that combines multiple indicators to provide insights into the market's strength and potential buying or selling opportunities. It incorporates the Relative Strength Index (RSI), Exponential Moving Average (EMA) lines, and the trend over the past three days to generate signals.
The indicator calculates a combined data value by assigning weights to the RSI, EMA, and past trend. The RSI measures the strength of price movements, while the EMA lines provide an indication of the average price over a specific period. The past trend considers the price behavior over the last three days. By combining these factors, the indicator offers a comprehensive view of market conditions.
Buy and sell signals are generated based on the change in the combined data. A buy signal occurs when there is an increase in the combined data above a specified threshold, indicating a potential buying opportunity. Conversely, a sell signal is triggered when there is a decrease in the combined data below a specified threshold, suggesting a potential selling opportunity.
The indicator also plots the EMA lines, which include the EMA High, EMA Average, and EMA Low. These lines provide additional visual cues about the price trend and potential support and resistance levels.
Traders can use the Combined Indicator with EMA Lines to identify potential entry and exit points in the market. It helps in capturing trends, evaluating price strength, and making informed trading decisions. The buy and sell signals, along with the EMA lines, aid in spotting potential reversals, confirming trends, and managing risk.
It's important to note that this indicator should be used in conjunction with other analysis techniques and risk management strategies. Traders should consider combining it with additional indicators, chart patterns, and fundamental analysis to enhance their trading decisions.
Remember to backtest and validate the indicator's performance using historical data before using it in real-time trading. Adjust the input parameters, such as RSI period, EMA period, and threshold values, to suit your trading style and market conditions.
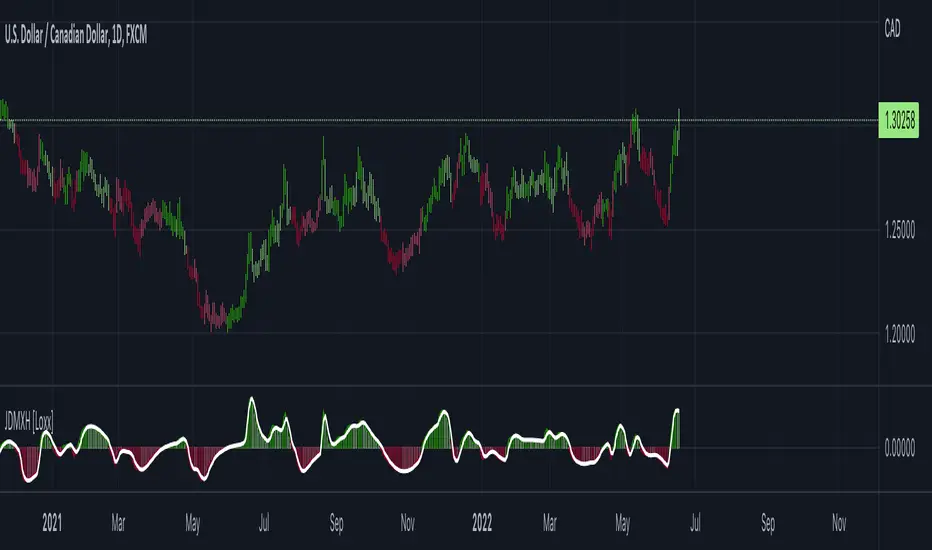
Jurik DMX Histogram [Loxx]Jurik DMX Histogram is the ultra-smooth, low lag version of your classic DMI indicator.
What is the directional movement index?
The directional movement index (DMI) is an indicator developed by J. Welles Wilder in 1978 that identifies in which direction the price of an asset is moving. The indicator does this by comparing prior highs and lows and drawing two lines: a positive directional movement line (+DI) and a negative directional movement line (-DI). An optional third line, called the average directional index (ADX), can also be used to gauge the strength of the uptrend or downtrend.
When +DI is above -DI, there is more upward pressure than downward pressure in the price. Conversely, if -DI is above +DI, then there is more downward pressure on the price. This indicator may help traders assess the trend direction. Crossovers between the lines are also sometimes used as trade signals to buy or sell.
What is Jurik Volty used in the Juirk Filter?
One of the lesser known qualities of Juirk smoothing is that the Jurik smoothing process is adaptive. "Jurik Volty" (a sort of market volatility ) is what makes Jurik smoothing adaptive. The Jurik Volty calculation can be used as both a standalone indicator and to smooth other indicators that you wish to make adaptive.
What is the Jurik Moving Average?
Have you noticed how moving averages add some lag (delay) to your signals? ... especially when price gaps up or down in a big move, and you are waiting for your moving average to catch up? Wait no more! JMA eliminates this problem forever and gives you the best of both worlds: low lag and smooth lines.
Ideally, you would like a filtered signal to be both smooth and lag-free. Lag causes delays in your trades, and increasing lag in your indicators typically result in lower profits. In other words, late comers get what's left on the table after the feast has already begun.
What is an adaptive cycle, and what is Ehlers Autocorrelation Periodogram Algorithm?
From his Ehlers' book Cycle Analytics for Traders Advanced Technical Trading Concepts by John F. Ehlers , 2013, page 135:
"Adaptive filters can have several different meanings. For example, Perry Kaufman’s adaptive moving average ( KAMA ) and Tushar Chande’s variable index dynamic average ( VIDYA ) adapt to changes in volatility . By definition, these filters are reactive to price changes, and therefore they close the barn door after the horse is gone.The adaptive filters discussed in this chapter are the familiar Stochastic , relative strength index ( RSI ), commodity channel index ( CCI ), and band-pass filter.The key parameter in each case is the look-back period used to calculate the indicator. This look-back period is commonly a fixed value. However, since the measured cycle period is changing, it makes sense to adapt these indicators to the measured cycle period. When tradable market cycles are observed, they tend to persist for a short while.Therefore, by tuning the indicators to the measure cycle period they are optimized for current conditions and can even have predictive characteristics.
The dominant cycle period is measured using the Autocorrelation Periodogram Algorithm. That dominant cycle dynamically sets the look-back period for the indicators. I employ my own streamlined computation for the indicators that provide smoother and easier to interpret outputs than traditional methods. Further, the indicator codes have been modified to remove the effects of spectral dilation.This basically creates a whole new set of indicators for your trading arsenal."
Included
- Toggle on/off bar coloring
Market Sector Scanner/Screener With MOM + RSI + MFI + DMI + MACDMARKET SECTOR SCANNER/SCREENER MOM + RSI + MFI + DMI + MACD FOR STOCKS CRYPTO & FOREX
This script scans 9 markets constantly and returns the values of 5 different popular indicators.
This indicator helps you see when one of your favorite stocks is bullish or bearish when you are not watching that chart so you can always catch the big moves as they happen.
***HOW TO USE***
A great way to use this market screener is to set up separate chart layouts for each sector you like to trade. Such as the top 9 stocks in the S & P 500, top 9 stocks in the XLF etf, etc. Make sure to set up separate chart layouts in Tradingview so you don’t have to change the symbols constantly. This will give you a good idea in real time if that entire sector is bullish, bearish or mixed. When the entire grid goes red or green, those are very strong signs of market direction across that entire sector, so trades in the corresponding direction are quite safe.
This can be done for crypto as well, using the top 9 cryptocurrencies by market cap. Watch the grid and wait for the entire lot to turn green or red and then take a position in that direction.
You can also use this with a variety of your favorite tickers so you can see when specific markets are looking strong in either direction, instead of constantly changing charts or missing good opportunities because you weren’t watching that specific chart.
This grid can also be used to determine how long to hold a position as well. If the entire grid is still green or red, according to your trade direction, you can usually expect price to continue in that direction until you see some conflicting colors start to pop up on the grid. As it starts to give mixed signals, you can expect the market to be indecisive or reverse which is a good time to get out.
If you have your scanner setup to show similar markets in one sector, be careful taking trades when the grid is very mixed in color. This shows signs of indecision and will likely have choppy price action until the market decides a direction so make sure to use caution when the grid is mixed. It is best to wait for the entire grid to turn green or red and then take position.
***COLOR MEANINGS***
When each indicator value is in bullish territory, the background of that value will turn green.
When each indicator value is in bearish territory, the background of that value will turn red.
When each indicator value is in neutral territory, the background of that value will turn blue.
When all 5 indicators for a ticker are bullish, the ticker background will turn green.
When all 5 indicators for a ticker are bearish, the ticker background will turn red.
When there is a mixture of bullish and bearish values, the ticker background will turn blue.
***CUSTOMIZATION***
You can customize which tickers are in your scanner including stocks, crypto, futures and forex, the source of the indicators, the length of the indicator settings and the smoothing parameters.
***INDICATORS USED***
The indicators used for each ticker are as follows:
Momentum(MOM) - Default length is 14. Bullish is above zero, bearish is below zero.
Relative Strength Index(RSI) - Default length is 14. Bullish is above 50, bearish is below 50.
Money Flow Index(MFI) - Default length is 14. Bullish is above 50, bearish is below 50.
Directional Movement Index(DMI) - Default length is 14 and smoothing is 14. Calculated by subtracting di minus from di plus. If the value is positive, it is bullish. If the value is negative, it is bearish.
Moving Average Convergence & Divergence(MACD) - Default settings are 12, 26, 9. If the short line is greater than the long line, then it is bullish. If the short line is less than the long line, it is bearish.
***MARKETS***
This market scanner can be used as a signal on all markets, including stocks, crypto, futures and forex.
***TIMEFRAMES***
This scanner can be used on all timeframes and pulls data from other tickers using the same timeframe as what your current chart is set to.
***TIPS***
Try using numerous indicators of ours on your chart so you can instantly see the bullish or bearish trend of multiple indicators in real time without having to analyze the data. Some of our favorites are Trend Friend Scalp & Swing Signals, Auto Fibonacci, Directional Movement Index, Volume Profile With Buy/Sell Pressure, Auto Support And Resistance and Money Flow Index in combination with this Scanner. They all have real time Bullish and Bearish labels as well so you can immediately understand each indicator's trend.

Delta-RSI Strategy (with filters)Delta-RSI Strategy (with filters):
This is a version of the Delta-RSI Oscillator strategy with several criteria available to filter entry and exit signals. This script is also suitable for backtesting over a user-defined period and offers several risk management options (take profit and stop loss).
Since the publication of the Delta-RSI Oscillator script, I have been asked many times to make it compatible with the Strategy Tester and add filtering criteria to minimize "false" signals. This version covers many of these requests. Feel free to insert your favorite D-RSI parameters and play around!
ABOUT DELTA-RSI
Delta-RSI represents a smoothed time derivative of the RSI designed as a momentum indicator (see links below):
INPUT DESCTIPTION
MODEL PARAMETERS
Polynomial Order : The order of local polynomial used to interpolate the relative strength index (RSI).
Length : The length of the lookback frame where local regression is applied.
RSI Length : The timeframe of RSI used as input.
Signal Length : The signal line is a EMA of the D-RSI time series. This input parameter defines the EMA length.
ALLOWED ENTRIES
The strategy can include long entries, short entries or both.
ENTRY AND EXIT CONDITIONS
Zero-crossing : bullish trade signal triggered when D-RSI crosses zero from negative to positive values (bearish otherwise)
Signal Line Crossing : bullish trade signal triggered when D-RSI crosses from below to above the signal line (bearish otherwise)
Direction Change : bullish trade signal triggered when D-RSI was negative and starts ascending (bearish otherwise)
APPLY FILTERS TO
The filters (described below) can be applied to long entry, short entry and exit signals.
RELATIVE VOLUME FILTER
When activated, the D-RSI-driven entries and exits will be triggered only if the current volume is greater than N times the average over the last M bars.
VOLATILITY FILTER
When activated, the D-RSI-driven entries and exits will be triggered only if the N-period average true range, ATR, is greater than the M-period ATR. If N < M, this condition implies increasing volatility.
OVERBOUGHT/OVERSOLD FILTER
When activated, the D-RSI-driven entries and exits will be triggered only if the value of 14-period RSI is in the range between N and M.
STOP LOSS/TAKE PROFIT
Fixed and trailing stop loss as well as take profit options are available.
FIXED BACKTESTING START/END DATES
If the checkboxes are not checked, the strategy will backtest all available price bars.

Open Interest Money Flow Index (OIMFI)CAUTION : This system was inspired from seiglerj' s "Money Flow Index " script. Open Interests are used instead of volume.
What is the Money Flow Index ( MFI )?
The Money Flow Index ( MFI ) is a technical oscillator that uses price and volume for identifying overbought or oversold conditions in an asset. It can also be used to spot divergences which warn of a trend change in price. The oscillator moves between 0 and 100.
Unlike conventional oscillators such as the Relative Strength Index ( RSI ), the Money Flow Index incorporates both price and volume data, as opposed to just price. For this reason, some analysts call MFI the volume-weighted RSI .
What Does the Money Flow Index ( MFI ) Tell You?
One of the primary ways to use the Money Flow Index is when there is a divergence. A divergence is when the oscillator is moving in the opposite direction of price. This is a signal of a potential reversal in the prevailing price trend.
For example, a very high Money Flow Index that begins to fall below a reading of 80 while the underlying security continues to climb is a price reversal signal to the downside. Conversely, a very low MFI reading that climbs above a reading of 20 while the underlying security continues to sell off is a price reversal signal to the upside.
Traders also watch for larger divergences using multiple waves in the price and MFI . For example, a stock peaks at $10, pulls back to $8, and then rallies to $12. The price has made two successive highs, at $10 and $12. If MFI makes a lower higher when the price reaches $12, the indicator is not confirming the new high. This could foreshadow a decline in price.
The overbought and oversold levels are also used to signal possible trading opportunities. Moves below 10 and above 90 are rare. Traders watch for the MFI to move back above 10 to signal a long trade, and to drop below 90 to signal a short trade.
Other moves out of overbought or oversold territory can also be useful. For example, when an asset is in an uptrend, a drop below 20 (or even 30) and then a rally back above it could indicate a pullback is over and the price uptrend is resuming. The same goes for a downtrend. A short-term rally could push the MFI up to 70 or 80, but when it drops back below that could be the time to enter a short trade in preparation for another drop .
Reference : www.investopedia.com
WARNING :
** Since each instrument in the list has its own unique contract data, you must first enter its name to display it. I recommend you to select OANDA from the markets. Finally, when the COT reports are issued, it may repaints. However, this repaint is usually close to closing or after close .(When COT reports are so sharp ) So use this script only 1W ( 1 week ) or 1 M ( 1 month ) timeframe.
** This data is taken to Tradingview with the help of Quandl. This is a very low possibility, but the system will not work if there is a malfunction.
FEATURES :
*** Working with all futures (Including : Bitcoin )
*** If you dont work with "Futures" , you can select "Others" from switchable menu and use volume for all instruments.
*** New generation elegant design used : Adaptive coloring Overbought - Oversold Levels according to the closing price.
NOTE : This code is open source under the MIT License. If you have any improvements or corrections to suggest, please send me a pull request via the github repository github.com
Stay tuned. Best wishes !

RSI & RVI OB/OS Alert ArrowThe script shows arrows on bars that are in overbought or oversold, based on the set parameters of Relative Strength Index ( RSI ) and Relative Volatility Index (RVI).
Also there is a universal allert, which includes both conditions - overbought and oversold.
You can change the period of RSI and RVI, as well as the upper and lower boundaries of these indicators.
Canuck Trading Projection IndicatorCanuck Trading Projection Indicator
Overview
The Canuck Trading Projection Indicator is a powerful PineScript v6 tool designed for TradingView to project potential bullish and bearish price trajectories based on historical price and volume movements. It provides traders with actionable insights by estimating future price targets and assigning confidence levels to each outlook, helping to identify probable market directions across any timeframe. Ideal for both short-term and long-term traders, this indicator combines momentum analysis, RSI filtering, support/resistance detection, and time-weighted trend analysis to deliver robust projections.
Features
Bullish and Bearish Projections: Forecasts price targets for upward (bullish) and downward (bearish) movements over a user-defined projection period (default 20 bars).
Confidence Levels: Assigns percentage confidence scores to each outlook, reflecting the likelihood of the projected price based on historical trends, volatility, and volume.
RSI Filter: Incorporates a 14-period Relative Strength Index (RSI) to validate trends, requiring RSI > 50 for bullish and RSI < 50 for bearish signals.
Support/Resistance Detection: Adjusts confidence levels when projections are near key swing highs/lows (within 2% of average price), boosting confidence by 5% for alignments.
Time-Based Weighting: Prioritizes recent price movements in trend analysis, giving more weight to newer bars for improved relevance.
Customizable Inputs: Allows users to tailor lookback period, projection bars, RSI period, confidence threshold, colors, and label positioning.
Forced Label Spacing: Prevents overlap of bullish and bearish text labels, even for tight projections, using fixed vertical slots when price differences are small (<2% of average price).
Timeframe Flexibility: Works seamlessly across all TradingView timeframes (e.g., 30-minute, hourly, daily, weekly, monthly), adapting projections to the chart’s resolution.
Clean Visualization: Displays projections as green (bullish) and red (bearish) dashed lines, with non-overlapping text labels at the projection endpoints showing price targets and confidence levels.
How It Works
The indicator analyzes historical price and volume data over a user-defined lookback period (default 50 bars) to calculate:
Momentum: Combines price changes and volume to assess trend strength, using a weighted moving average (WMA) for directional bias.
Trend Analysis: Counts bullish (price up, volume above average, RSI > 50) and bearish (price down, volume above average, RSI < 50) trends, weighting recent bars more heavily.
Projections:
Bullish Slope: Positive or flat when momentum is upward, scaled by price change and momentum intensity.
Bearish Slope: Negative or flat when momentum is downward, amplified by bearish confidence for stronger projections.
Projects prices forward by 20 bars (default) using current close plus slope times projection bars.
Confidence Levels:
Base confidence derived from the proportion of bullish/bearish trends, with a 5% minimum to avoid zero confidence.
Adjusted by volatility (lower volatility increases confidence), volume trends, and proximity to support/resistance levels.
Visualization:
Draws projection lines from the current close to the 20-bar future target.
Places text labels at line endpoints, showing price targets and confidence percentages, with forced spacing for readability.
Input Parameters
Lookback Period (default: 50): Number of bars for historical analysis (minimum 10).
Projection Bars (default: 20): Number of bars to project forward (minimum 5).
Confidence Threshold (default: 0.6): Minimum confidence for strong trend indication (0.1 to 1.0).
Bullish Projection Line Color (default: Green): Color for bullish projection line and label.
Bearish Projection Line Color (default: Red): Color for bearish projection line and label.
RSI Period (default: 14): Period for RSI momentum filter (minimum 5).
Label Vertical Offset (%) (default: 1.0): Base offset for labels as a percentage of price range (0.1% to 5.0%).
Minimum Label Spacing (%) (default: 2.0): Minimum vertical spacing between labels for tight projections (0.5% to 10.0%).
Usage Instructions
Add to Chart: Copy the script into TradingView’s Pine Editor, save, and add the indicator to your chart.
Select Timeframe: Apply to any timeframe (e.g., 30-minute, hourly, daily, weekly, monthly) to match your trading strategy.
Interpret Outputs:
Green Line/Label: Bullish price target and confidence (e.g., "Bullish: 414.37, Confidence: 35%").
Red Line/Label: Bearish price target and confidence (e.g., "Bearish: 279.08, Confidence: 41.3%").
Higher confidence indicates a stronger likelihood of the projected outcome.
Adjust Inputs:
Modify Lookback Period to focus on shorter/longer historical trends (e.g., 20 for short-term, 100 for long-term).
Change Projection Bars to adjust forecast horizon (e.g., 10 for shorter, 50 for longer).
Tweak RSI Period or Confidence Threshold for sensitivity to momentum or trend strength.
Customize Colors for visual preference.
Increase Minimum Label Spacing if labels overlap in volatile markets.
Combine with Analysis: Use alongside other indicators (e.g., moving averages, Bollinger Bands) or fundamental analysis to confirm signals, as projections are probabilistic.
Example: TSLA Across Timeframes
Using live TSLA data (close ~346.46 USD, May 31, 2025), the indicator produces:
30-Minute: Bullish 341.93 (13.3%), Bearish 327.96 (86.7%) – Strong bearish sentiment due to intraday volatility.
1-Hour: Bullish 342.00 (33.9%), Bearish 327.50 (62.3%) – Bearish but less intense, reflecting hourly swings.
4-Hour: Bullish 345.52 (73.4%), Bearish 344.44 (19.0%) – Flat outlook, indicating consolidation.
Daily: Bullish 391.26 (68.8%), Bearish 302.22 (31.2%) – Bullish bias from recent uptrend, bearish tempered by longer lookback.
Weekly: Bullish 414.37 (35.0%), Bearish 279.08 (41.3%) – Wide range, reflecting annual volatility.
Monthly: Bullish 396.70 (54.9%), Bearish 296.93 (10.2%) – Long-term bullish optimism.
These results align with market dynamics: short-term intervals capture volatility, while longer intervals smooth trends, providing balanced outlooks.
Notes
Accuracy: Projections are estimates based on historical data and should be used with other analysis tools. Confidence levels indicate likelihood, not certainty.
Timeframe Sensitivity: Short-term intervals (e.g., 30-minute) show larger price swings and higher confidence due to volatility, while longer intervals (e.g., monthly) are more stable.
Customization: Adjust inputs to match your trading style (e.g., shorter lookback for day trading, longer for swing trading).
Performance: Tested on volatile stocks like TSLA, NVIDIA, and others, ensuring robust performance across markets.
Limitations: May produce conservative bearish projections in strong uptrends due to momentum weighting. Adjust lookback or projection_bars for sensitivity.
Feedback
If you encounter issues (e.g., label overlap, projection mismatches), please share your timeframe, settings, or a screenshot. Suggestions for enhancements (e.g., additional filters, visual tweaks) are welcome!
Disclaimer
The Canuck Trading Projection Indicator is provided for educational and informational purposes only. It is not financial advice. Trading involves significant risks, and past performance is not indicative of future results. Always perform your own due diligence and consult a qualified financial advisor before making trading decisions.
